Multiple Choice
Figure 5-1
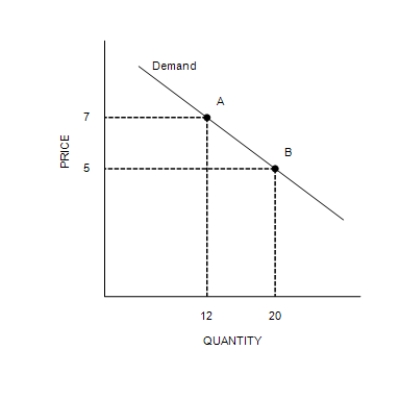
-Refer to Figure 5-1. Between point A and point B on the graph, demand is
A) perfectly elastic.
B) inelastic.
C) unit elastic.
D) elastic, but not perfectly elastic.
Correct Answer:

Verified
Correct Answer:
Verified
Related Questions
Q10: Suppose demand is given by the equation:<br>Q<sup>D
Q11: If the income elasticity of demand for
Q12: If we observe that when the price
Q13: The OPEC oil cartel has difficulty maintaining
Q14: If the quantity supplied is exactly the
Q16: Table 5-5<br><br><br> <span class="ql-formula" data-value="\begin{array}
Q17: Figure 5-6<br> <img src="https://d2lvgg3v3hfg70.cloudfront.net/TB7555/.jpg" alt="Figure 5-6
Q18: Suppose that two supply curves pass through
Q19: Suppose the cross-price elasticity of demand between
Q20: In the short run, as compared to