Multiple Choice
Figure 5-12 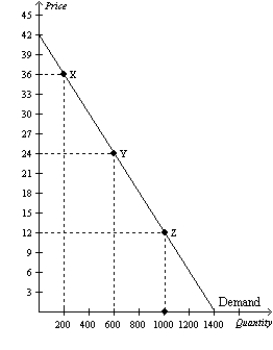
-Refer to Figure 5-12.Using the midpoint method,the price elasticity of demand between point X and point Y is
A) 0.4.
B) 1.
C) 2.
D) 2.5.
Correct Answer:

Verified
Correct Answer:
Verified
Q15: Figure 5-1<br> <img src="https://d2lvgg3v3hfg70.cloudfront.net/TB7555/.jpg" alt="Figure 5-1
Q252: For a particular good,an 8 percent increase
Q253: Figure 5-8 <img src="https://d2lvgg3v3hfg70.cloudfront.net/TB2297/.jpg" alt="Figure 5-8
Q254: If the price of natural gas rises,when
Q255: Demand is said to be unit elastic
Q256: Figure 5-5 <img src="https://d2lvgg3v3hfg70.cloudfront.net/TB2297/.jpg" alt="Figure 5-5
Q259: Suppose that when the price of good
Q260: Figure 5-5 <img src="https://d2lvgg3v3hfg70.cloudfront.net/TB2297/.jpg" alt="Figure 5-5
Q261: Figure 5-7 <img src="https://d2lvgg3v3hfg70.cloudfront.net/TB2297/.jpg" alt="Figure 5-7
Q262: Figure 5-3 <img src="https://d2lvgg3v3hfg70.cloudfront.net/TB2297/.jpg" alt="Figure 5-3