Multiple Choice
Table 5-7
The following table shows a portion of the demand schedule for a particular good at various levels of income. 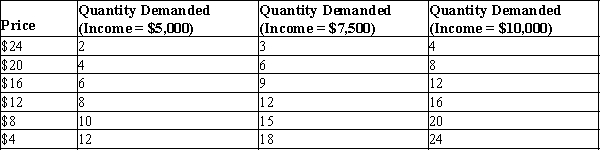
-Refer to Table 5-7. Using the midpoint method, when income equals $7,500, what is the price elasticity of demand between $16 and $20?
A) 0.56
B) 0.75
C) 1.33
D) 1.80
Correct Answer:

Verified
Correct Answer:
Verified
Q18: When supply is perfectly elastic,the value of
Q32: Necessities tend to have inelastic demands, whereas
Q42: If sellers do not adjust their quantities
Q52: An increase in the price of cheese
Q64: If the price elasticity of demand for
Q131: If the income elasticity of demand for
Q185: Helen's Honey Hut supplies 20 jars of
Q247: Table 5-5 <img src="https://d2lvgg3v3hfg70.cloudfront.net/TB1273/.jpg" alt="Table 5-5
Q274: Consider luxury weekend hotel packages in Las
Q287: When we move upward and to the