Multiple Choice
Table 5-7
The following table shows a portion of the demand schedule for a particular good at various levels of income. 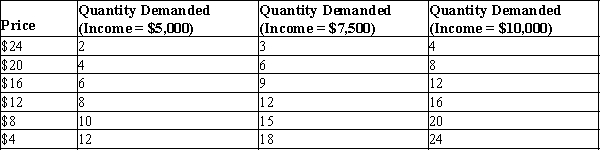
-Refer to Table 5-7. Using the midpoint method, at a price of $12, what is the income elasticity of demand when income rises from $5,000 to $10,000?
A) 0.00
B) 0.41
C) 1.00
D) 2.45
Correct Answer:

Verified
Correct Answer:
Verified
Q14: The price elasticity of supply measures how
Q73: Which of the following was not a
Q116: If a 15% increase in price for
Q126: Suppose that Jane enjoys Diet Coke so
Q158: Suppose the price elasticity of demand for
Q201: Suppose a farmer knows that he will
Q208: Demand is inelastic if the price elasticity
Q224: If a 10% decrease in price for
Q225: Suppose that gasoline prices increase dramatically this
Q256: Figure 5-5 <img src="https://d2lvgg3v3hfg70.cloudfront.net/TB2297/.jpg" alt="Figure 5-5