Multiple Choice
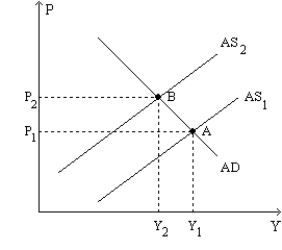
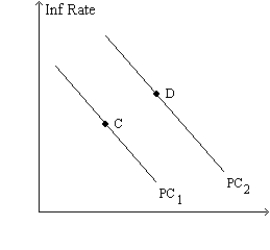
Figure 35-9.The left-hand graph shows a short-run aggregate-supply (SRAS) curve and two aggregate-demand (AD) curves.On the right-hand diagram,"Inf Rate" means "Inflation Rate." 

-Refer to Figure 35-9.What is measured along the horizontal axis of the right-hand graph?
A) time
B) the unemployment rate
C) real GDP
D) the growth rate of real GDP
Correct Answer:

Verified
Correct Answer:
Verified
Q1: A favorable supply shock will cause inflation
Q2: An adverse supply shock causes output to<br>A)rise.To
Q4: Which of the following is correct if
Q6: If the Fed wants to reverse the
Q7: In the 1970's the Federal Reserve responded
Q8: Figure 35-9.The left-hand graph shows a short-run
Q9: Suppose that a small economy that produces
Q10: The large increase in oil prices in
Q11: In response to an adverse supply shock,suppose
Q85: If there is an increase in the