Multiple Choice
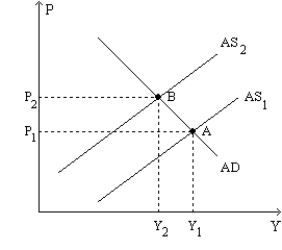
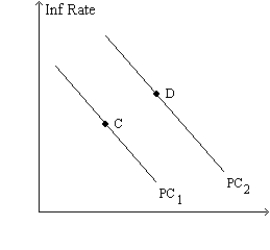
Figure 35-9.The left-hand graph shows a short-run aggregate-supply (SRAS) curve and two aggregate-demand (AD) curves.On the right-hand diagram,"Inf Rate" means "Inflation Rate." 

-Refer to Figure 35-9.The shift of the aggregate-supply curve from AS1 to AS2 could be a consequence of
A) an increase in the money supply.
B) an adverse supply shock.
C) a decrease of output from Y1 to Y2.
D) a slow adjustment of people's expectation of the inflation rate.
Correct Answer:

Verified
Correct Answer:
Verified
Q13: A shock increases the costs of production.Given
Q14: In 1980,the U.S.misery index was<br>A)much higher than
Q15: Which of the following would cause the
Q16: If a central bank decreases the money
Q18: There is an adverse supply shock.In response
Q19: An adverse supply shock will cause output<br>A)and
Q20: In the United States during the 1970s,expected
Q21: If the Federal Reserve accommodates an adverse
Q22: A central bank that accommodates an aggregate
Q140: If there is an adverse supply shock