Multiple Choice
Figure 34-6.On the left-hand graph,MS represents the supply of money and MD represents the demand for money;on the right-hand graph,AD represents aggregate demand.The usual quantities are measured along the axes of both graphs. 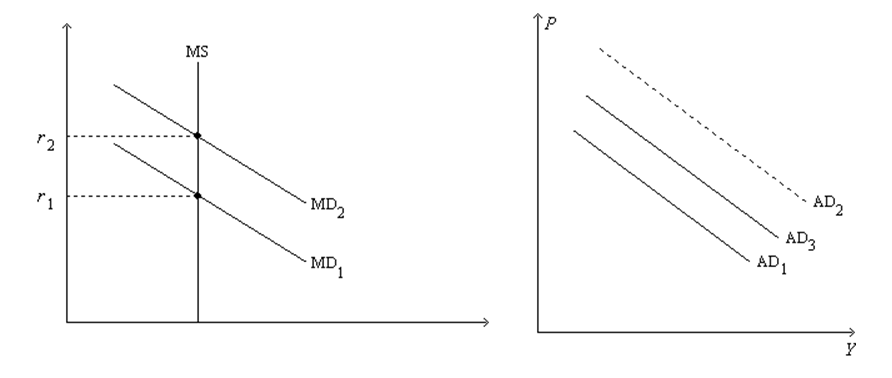
-Refer to Figure 34-6.Suppose the graphs are drawn to show the effects of an increase in government purchases.If it were not for the increase in r from r1 to r2,then
A) there would be no crowding out.
B) the full multiplier effect of the increase in government purchases would be realized.
C) the AD curves that actually apply,before and after the change in government purchases,would be separated horizontally by the distance equal to the multiplier times the change in government purchases.
D) All of the above are correct.
Correct Answer:

Verified
Correct Answer:
Verified
Q24: An decrease in taxes shifts aggregate demand<br>A)to
Q26: Which of the following sequences best represents
Q27: Tax increases<br>A)and increases in government expenditures shift
Q28: An increase in government spending<br>A)increases the interest
Q30: In a certain economy,when income is $1000,consumer
Q31: Sometimes during wars,government expenditures are larger than
Q32: Which of the following illustrates how the
Q33: Suppose the multiplier has a value that
Q34: In a certain economy,when income is $500,consumer
Q177: The government builds a new water-treatment plant.