Multiple Choice
Figure 34-4.On the figure,MS represents money supply and MD represents money demand. 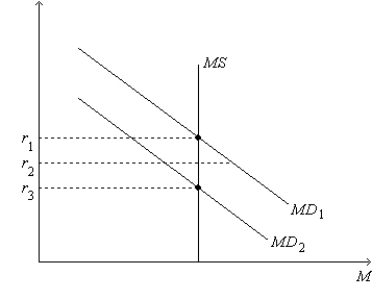
-Refer to Figure 34-4.Which of the following events could explain a shift of the money-demand curve from MD1 to MD2?
A) a decrease in the price level
B) a decrease in the cost of borrowing
C) an increase in the price level
D) an increase in the cost of borrowing
Correct Answer:

Verified
Correct Answer:
Verified
Q4: People are likely to want to hold
Q81: According to the theory of liquidity preference,if
Q83: Which of the following Fed actions would
Q84: Which of the effects listed below increases
Q85: In the short run,open-market purchases<br>A)increase investment and
Q87: Figure 34-1 <img src="https://d2lvgg3v3hfg70.cloudfront.net/TB2297/.jpg" alt="Figure 34-1
Q88: To decrease the interest rate the Federal
Q89: An increase in the interest rate could
Q90: The most important reason for the slope
Q91: The theory of liquidity preference illustrates the