Multiple Choice
Figure 34-4.On the figure,MS represents money supply and MD represents money demand. 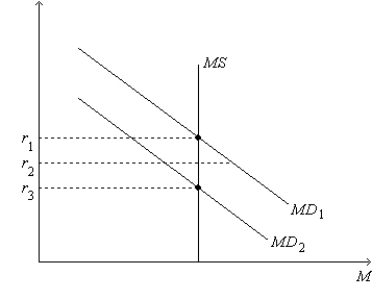
-Refer to Figure 34-4.Suppose the current equilibrium interest rate is r1.Let Y1 represent the corresponding quantity of goods and services demanded,and let P1 represent the corresponding price level.Starting from this situation,if the Federal Reserve increases the money supply and if the price level remains at P1,then
A) there will be an increase in the equilibrium quantity of goods and services demanded.
B) there will be a decrease in the equilibrium quantity of goods and services demanded.
C) there will be an increase in the equilibrium interest rate.
D) fewer firms will choose to borrow to build new factories and buy new equipment.
Correct Answer:

Verified
Correct Answer:
Verified
Q110: Which of the following would not be
Q141: Changes in the interest rate help explain<br>A)only
Q142: Figure 34-2.On the left-hand graph,MS represents the
Q143: For the U.S.economy,money holdings are a<br>A)large part
Q144: For the U.S.economy,which of the following is
Q145: According to the interest-rate effect,an increase in
Q147: Which of the following events would shift
Q148: When households find themselves holding too much
Q150: Figure 34-4.On the figure,MS represents money supply
Q151: Which of the following statements is correct