Multiple Choice
Table 3-38 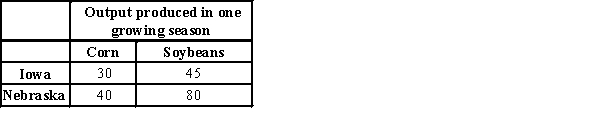
-Refer to Table 3-38. Iowa and Nebraska can both produce corn and soybeans, and can switch between the production of corn and soybeans at a constant rate. The table illustrates the amount of corn or soybeans each state can produce in one growing season. Using the information from the table, Iowa's opportunity cost of producing one bushel of corn is
A) 1.5 bushels of soybeans and Nebraska's is 2 bushels of soybeans.
B) 1.5 bushels of soybeans and Nebraska's is 0.5 bushels of soybeans.
C) 0.67 bushels of soybeans and Nebraska's is 2 bushels of soybeans.
D) 0.67 bushels of soybeans and Nebraska's is 0.5 bushels of soybeans.
Correct Answer:

Verified
Correct Answer:
Verified
Q17: Serena Williams should pay someone else to
Q52: Figure 3-19<br>Chile's Production Possibilities Frontier<br>Colombia's Production Possibilities
Q65: In one month, Moira can knit 2
Q128: Figure 3-16<br>Hosne's Production Possibilities Frontier<br>Merve's Production Possibilities
Q187: The gains from specialization and trade are
Q447: Table 3-19 Summary of the Gains from
Q448: Table 3-41<br><br> <img src="https://d2lvgg3v3hfg70.cloudfront.net/TB1273/.jpg" alt="Table 3-41
Q451: Table 3-34<br>Assume that Indonesia and India can
Q453: Table 3-31<br> <img src="https://d2lvgg3v3hfg70.cloudfront.net/TB1273/.jpg" alt="Table 3-31
Q455: Table 3-24<br>Assume that England and Spain can