Multiple Choice
Figure 26-4. On the horizontal axis of the graph, L represents the quantity of loanable funds in billions of dollars. 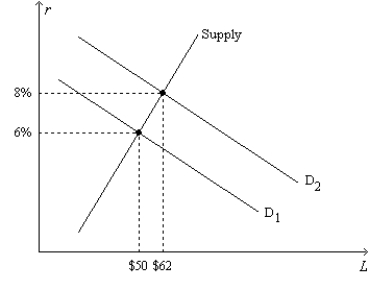
-Refer to Figure 26-4. Regard the position of the Supply curve as fixed, as on the graph. If the real interest rate is 4 percent, the inflation rate is 2 percent, and the market for loanable funds is in equilibrium, then the position of the demand-for-loanable-funds curve must be
A)  .
.
B)  .
.
C) between  and
and  .
.
D) to the left of  .
.
Correct Answer:

Verified
Correct Answer:
Verified
Q1: If Congress instituted an investment tax credit,the
Q57: Kroger's grocery chain wants to finance the
Q90: Managed mutual funds perform better on average
Q91: The Dow Jones Industrial Average has been
Q123: The model of the market for loanable
Q129: The slope of the demand for loanable
Q139: A change in the tax laws that
Q169: Suppose government expenditures on goods and services
Q209: What is a bond buyer promised when
Q565: A tech company loses a high-profile patent-infringement