Multiple Choice
The following diagram shows one indifference curve representing the preferences for goods X and Y for one consumer. 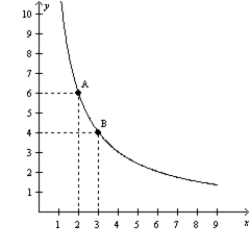 What is the marginal rate of substitution between points A and B?
A) 1/2
B) 4/3
C) 2
D) 3
Correct Answer:

Verified
Correct Answer:
Verified
Q58: What does the slope of a consumer's
Q161: A Giffen good is a good for
Q178: A consumer likes two goods: pizza and
Q201: Figure 21-5<br>(a)<br>(b) <img src="https://d2lvgg3v3hfg70.cloudfront.net/TB1273/.jpg" alt="Figure 21-5 (a)
Q230: Economic theory predicts that an increase in
Q317: Figure 21-3<br>In each case, the budget constraint
Q333: Abby, Bobbi, and Deborah each buy ice
Q351: Just as the theory of the competitive
Q362: Figure 21-13 <img src="https://d2lvgg3v3hfg70.cloudfront.net/TB1273/.jpg" alt="Figure 21-13
Q426: Economists represent a consumer's preferences using<br>A)demand curves.<br>B)budget