Multiple Choice
Figure 18-1
On the graph, L represents the quantity of labor and Q represents the quantity of output per week. 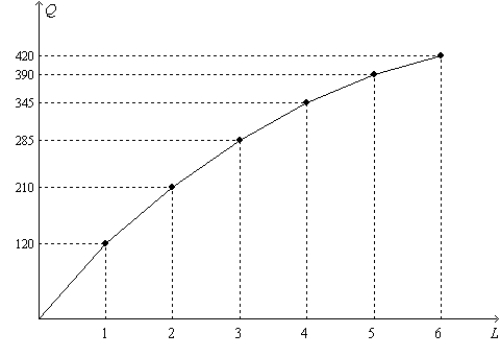
-Refer to Figure 18-1. Based on the shape of the curve, the
(i) total product is increasing.
(ii) total product is decreasing.
(iii) marginal product is increasing.
(iv) marginal product is decreasing.
A) (i) only
B) (i) and (iii) only
C) (i) and (iv) only
D) (ii) and (iv) only
Correct Answer:

Verified
Correct Answer:
Verified
Q3: Scenario 18-1<br>Harry owns a snow-removal business. He
Q37: Suppose the supply of capital decreases. As
Q63: Table 18-B<br>Consider the following daily production data
Q158: Figure 18-6 <img src="https://d2lvgg3v3hfg70.cloudfront.net/TB1273/.jpg" alt="Figure 18-6
Q166: An upward-sloping labor-supply curve implies that an
Q176: Figure 18-3 <img src="https://d2lvgg3v3hfg70.cloudfront.net/TB1273/.jpg" alt="Figure 18-3
Q285: Figure 18-11 <img src="https://d2lvgg3v3hfg70.cloudfront.net/TB1273/.jpg" alt="Figure 18-11
Q295: A significant slowdown in the growth of
Q319: A worker's contribution to a firm's revenue
Q524: Which of the following is not an