Multiple Choice
Exhibit 30-1
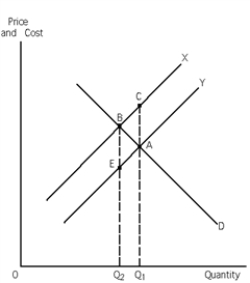
-Refer to Exhibit 30-1. This graph represents a negative externality situation. Given this, which of the two curves, X or Y, represents marginal social costs and why?
A) Curve X, because if there is a negative externality, external costs are associated with it: social costs = external costs + private costs, therefore the marginal social cost curve must lie above the marginal private cost curve.
B) Curve Y, because if there is a negative externality, negative external costs are associated with it: social costs = negative external costs + private costs, therefore the marginal social cost curve must lie below the marginal private cost curve.
C) Curve X, because if there is a negative externality, external benefits are associated with it: social costs = external benefits + private costs, therefore the marginal social cost curve must lie above the marginal private cost curve.
D) Curve Y, because if there is a negative externality, negative external benefits are associated with it: social costs = negative external benefits + private costs, therefore the marginal social cost curve must lie below the marginal private cost curve.
Correct Answer:

Verified
Correct Answer:
Verified
Q38: Under an emission tax, polluters _ what
Q39: A seller has some information about a
Q40: A consequence of a negative externality is
Q41: Under a tradable pollution permits system (cap
Q42: Exhibit 30-2<br><br> <img src="https://d2lvgg3v3hfg70.cloudfront.net/TB6992/.jpg" alt="Exhibit 30-2
Q44: Exhibit 30-5<br><br> <img src="https://d2lvgg3v3hfg70.cloudfront.net/TB6992/.jpg" alt="Exhibit 30-5
Q45: One consequence of a negative externality is
Q46: Maria lives next door to Alice. Alice
Q47: Generally, positive externalities result in<br>A)too much of
Q48: If a person who generates a negative