Multiple Choice
Exhibit 30-2
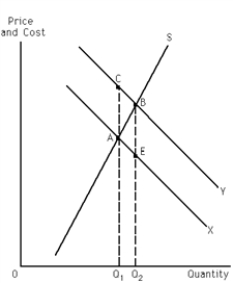
-Refer to Exhibit 30-2. This graph represents a positive externality situation. Given this, which of the two curves, X or Y, represents marginal social benefits and why?
A) Curve X, because if there is a positive externality, negative external benefits are associated with it: social costs external benefits - private benefits, therefore the marginal social benefit curve must lie below the marginal private benefit curve.
B) Curve X, because if there is a positive externality, external benefits are associated with it: social benefits = external benefits + private benefits, therefore the marginal social benefit curve must lie below the marginal private benefit curve.
C) Curve Y, because if there is a positive externality, external costs are associated with it: social benefits = external costs + private benefits, therefore the marginal social benefit curve must lie above the marginal private benefit cost curve.
D) Curve Y, because if there is a positive externality, external benefits are associated with it: social benefits = external benefits + private benefits, therefore the marginal social benefit curve must lie above the marginal private benefit curve.
Correct Answer:

Verified
Correct Answer:
Verified
Q109: Asymmetric information exists when<br>A) both parties to
Q151: The primary characteristic of a public good
Q152: Exhibit 30-4<br><br> <img src="https://d2lvgg3v3hfg70.cloudfront.net/TB6992/.jpg" alt="Exhibit 30-4
Q154: According to information in the textbook, in
Q155: Generally, negative externalities result in<br>A)too much of
Q157: Lemon laws _ the _ problem in
Q158: Suppose the production of a good results
Q159: If a positive externality exists, _ in
Q160: If the consumption of a good by
Q161: Suppose a particular production process results in