Multiple Choice
Exhibit 28-2
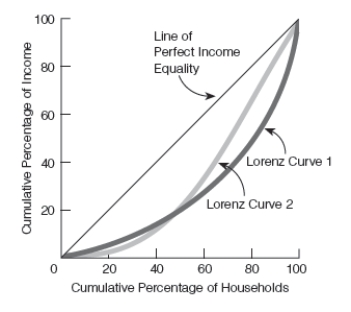
-Refer to Exhibit 28-2. This graph depicts the Lorenz curve for two countries, country 1 (Lorenz curve 1) and country 2 (Lorenz curve 2) . The Gini coefficient associated with Lorenz curve 1 appears to be ____________ than the Gini coefficient associated with Lorenz curve 2. This information indicates that the income distribution is ______________ equal in country 2 than in country 1.
A) lower; less
B) higher; less
C) lower; more
D) higher; more
Correct Answer:

Verified
Correct Answer:
Verified
Q43: In the United States, the average household
Q44: In 2015, the lowest 20 percent of
Q45: Which of the following was not given
Q46: In 2015, approximately 13.5 percent of the
Q47: The Gini coefficient measures the degree of<br>A)racial
Q49: Exhibit 28-2<br><br> <img src="https://d2lvgg3v3hfg70.cloudfront.net/TB6992/.jpg" alt="Exhibit 28-2
Q50: The larger the Gini coefficient, the<br>A)greater the
Q51: The existence of which of the following
Q52: Consider the area between the line of
Q53: A disappearing middle class necessarily connotes a