Multiple Choice
Exhibit 28-2
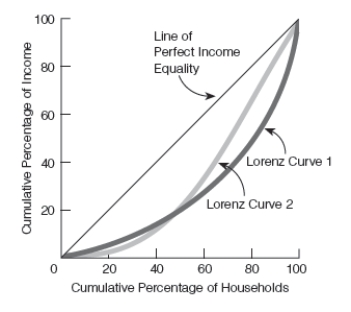
-A graph showing the relationship between the ____________________ and the ________________________ is called the ______________ curve.
A) cumulative percentage of households; cumulative percentage of income; Lorenz
B) cumulative percentage of households; cumulative percentage of income; Gini
C) cumulative percentage of households; cumulative percentage of income; Laffer
D) percentage of households living in poverty; percentage of households living above the poverty line; Lorenz
E) none of the above
Correct Answer:

Verified
Correct Answer:
Verified
Q29: The economist who said, "I am distressed
Q30: Smith and Jones are different when it
Q31: If the Gini coefficient is one (1),
Q32: Which of the following statements is true?<br>A)If
Q33: In the United States, there are _
Q35: If the Gini coefficient is zero (0),
Q36: To an economist, wage discrimination exists when<br>A)individuals
Q37: The Lorenz curve is a graphical representation
Q38: A person's labor income is equal to
Q39: Individual income is equal to labor income