Multiple Choice
Exhibit 19-5
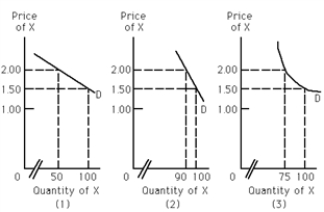
-Refer to Exhibit 19-5. For graph (3) , what is the price elasticity of demand going between $2.00 and $1.50?
A) 1.0
B) 0
C) 50.0
D) 0.02
Correct Answer:

Verified
Correct Answer:
Verified
Related Questions
Q99: If a demand curve is a straight
Q100: If the seller of good X raises
Q101: The quantity demanded of good A rises
Q102: If the price elasticity of demand for
Q103: Government wants to maximize its tax revenue
Q105: A Broadway play company can only charge
Q106: Exhibit 19-7<br><br> <img src="https://d2lvgg3v3hfg70.cloudfront.net/TB6992/.jpg" alt="Exhibit 19-7
Q107: The longer the period of time allowed
Q108: If the demand for a good is
Q109: Exhibit 19-9<br><br> <img src="https://d2lvgg3v3hfg70.cloudfront.net/TB6992/.jpg" alt="Exhibit 19-9