Multiple Choice
Use the following graph to answer the following questions.The graph depicts an economy where aggregate demand and long-run aggregate supply (LRAS) have decreased,with no change in short-run aggregate supply (SRAS) .
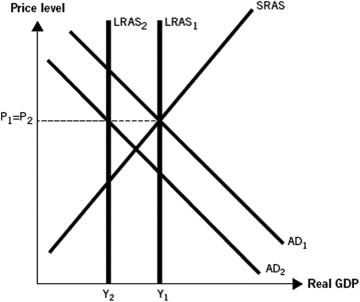
-The decline in housing prices contributed to the Great Recession,as depicted in the graph,in that it
A) caused real gross domestic product (GDP) and the price level to increase.
B) caused an increase in oil and gas prices,which led to inflation.
C) caused a decrease in household wealth and created a crisis in the loanable funds market.
D) caused an increase in household wealth and a crisis in the loanable funds market.
E) prevented unemployment from rising above historical averages.
Correct Answer:

Verified
Correct Answer:
Verified
Q110: Based on the belief that prices are
Q111: One difference between the Great Recession and
Q112: Use the following graph to answer the
Q113: The primary cause of the Great Depression
Q114: During the Great Recession,the U.S.aggregate demand curve
Q116: Which of the following economic statements would
Q117: A decline in U.S.wealth would tend to
Q118: The Great Recession lasted for _ months.<br>A)
Q119: Use the following graph to answer the
Q120: During the Great Recession,a(n)_ caused aggregate demand