Multiple Choice
Use the following graph to answer the following questions.This graph depicts an economy where aggregate demand has decreased,with no change in either short-run aggregate supply (SRAS) or long-run aggregate supply (LRAS) .
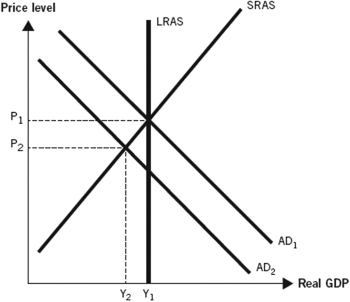
-During the Great Depression,the aggregate price level and real gross domestic product (GDP) both decreased,as depicted in the graph.Unemployment increased to record levels.Which of the following best explains why this happened?
A) A sudden increase in oil prices caused inflation and a deep recession.
B) A stock market crash,large numbers of bank failures,an increase in tax rates,and a tight money supply caused a recession.
C) A rapid decline in housing prices led to problems in the loanable funds market and a recession.
D) A significant decline in military spending following the end of a war led to a recession.
E) A sharp recession followed the United States abandoning the gold standard.
Correct Answer:

Verified
Correct Answer:
Verified
Q42: During the Great Recession,the U.S.aggregate demand curve
Q43: During the Great Depression,the U.S.aggregate demand curve
Q44: Use the following graph to answer the
Q45: Use the following graph to answer the
Q46: Among the beliefs held by classical economists,one
Q48: During the Great Recession,U.S.household wealth declined,leading to
Q49: When financial markets went into a crisis
Q50: Keynesian economists believe that government intervention in
Q51: Aside from what occurred with the Great
Q52: During the Great Depression,the U.S.aggregate demand curve