Multiple Choice
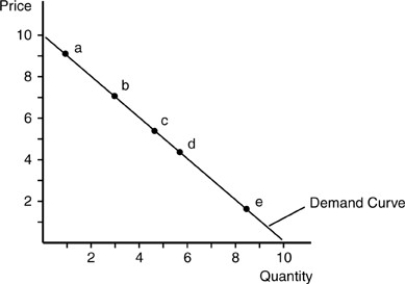
-In the above figure, along which range would total revenue rise by raising prices?
A) Between point a and point b
B) Between point c and point d
C) Between point d and point e
D) Above point a
Correct Answer:

Verified
Correct Answer:
Verified
Q115: A vertical supply curve may be described
Q153: Income elasticity of demand reflects<br>A) the change
Q241: Suppose the quantity demanded of ice cream
Q312: Inelastic demand implies<br>A) that a one percent
Q326: <img src="https://d2lvgg3v3hfg70.cloudfront.net/TB5018/.jpg" alt=" -Use the above
Q344: When quantity supplied is not very responsive
Q345: For which of the following would the
Q348: We say that a good has elastic
Q354: <img src="https://d2lvgg3v3hfg70.cloudfront.net/TB5013/.jpg" alt=" -In the above
Q375: The cross price elasticity of demand is