Multiple Choice
According to the data presented in the graph, between 1960 and 2000, CO2 levels rose approximately ppm. 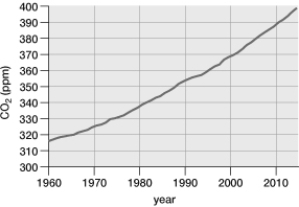
A) 50
B) 70
C) 370
D) 20
E) 320
Correct Answer:

Verified
Correct Answer:
Verified
Related Questions
Q5: Plants absorb small amounts of carbon from
Q64: The primary consumers in marine food chains
Q67: List and discuss three effects of acid
Q74: What would happen to an ecosystem if
Q99: There is a school of thought that
Q100: If a fox eats a rodent that
Q101: is (are) a crucial nutrient reservoir of
Q102: What proportion of the solar radiation that
Q108: A rancher begins raising sheep on the
Q121: Carbon dioxide is the only greenhouse gas.