Multiple Choice
The graph indicates that since 1960, global average temperatures have 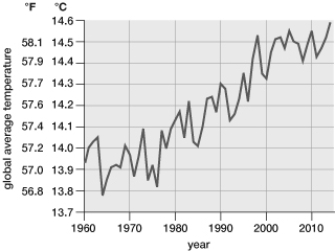
A) initially increased but are now dropping.
B) only decreased.
C) remained constant.
D) only increased.
E) fluctuated but risen overall.
Correct Answer:

Verified
Correct Answer:
Verified
Related Questions
Q2: In 1956, people in Minamata, Japan, began
Q4: Which trophic level has the LEAST biological
Q6: Phosphorus, which is often a limiting nutrient
Q8: This graph, which is based on estimates
Q9: Which nutrient cycle lacks an atmospheric reservoir?<br>A)
Q10: Burning coal and oil to release energy
Q11: What are the sources of sulfur in
Q12: Detritus feeders consume<br>A) dead organic matter.<br>B) fungi
Q46: Organisms that produce their own food in
Q110: Suppose a gardener puts a chemical on