Multiple Choice
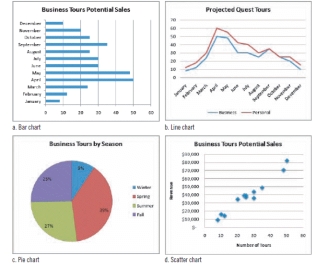
-Referring to the figure above, to show directions or trends in a linear data series over time you would use the ____ chart.
A) pie
B) bar
C) line
D) scatter
Correct Answer:

Verified
Correct Answer:
Verified
Related Questions
Q20: MODIFIED TRUE/FALSE<br>-When electronic spreadsheets were first developed,
Q21: The _ value of a set of
Q22: MODIFIED TRUE/FALSE<br>-The <u>mean</u> of a set of
Q23: Please identify the letter of the choice
Q24: Like OpenOffice Calc, _ is a free,
Q26: When modeling a decision using _ data,
Q27: The mode is the most common descriptive
Q28: MODIFIED TRUE/FALSE<br>-<u>Standard deviation</u> is a measure of
Q29: The _ are values in the results
Q30: Decision variables are values that could change