Multiple Choice
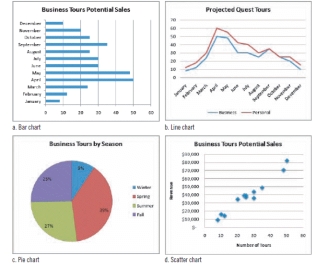
-Referring to the figure above, if you wanted to compare the percentage of an element to the whole, you would use the ____ chart.
A) pie
B) bar
C) line
D) scatter
Correct Answer:

Verified
Correct Answer:
Verified
Related Questions
Q29: The _ are values in the results
Q30: Decision variables are values that could change
Q31: When normalizing, you usually _ the data
Q32: MODIFIED TRUE/FALSE<br>-A <u>cell reference</u> is a pointer
Q33: Decision variables are often used in formulas
Q35: MODIFIED TRUE/FALSE<br>-A <u>DSS</u> is ideal for analyzing
Q36: A decision tree is a support tool
Q37: Although means are affected by extremely large
Q38: <img src="https://d2lvgg3v3hfg70.cloudfront.net/TB1866/.jpg" alt=" -The survey shown
Q39: MODIFIED TRUE/FALSE<br>-<u>Variables</u> are elements that are not