Multiple Choice
Figure 7.2
Assume 10⁹ E.coli cells/ml are in a flask.
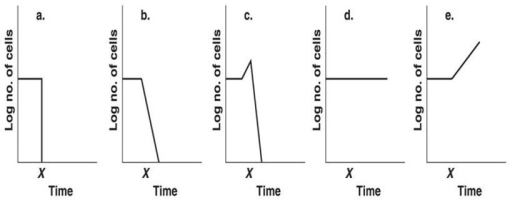
-Which graph in Figure 7.2 best depicts the effect of placing the culture at 7°C at time x?
A) a
B) b
C) c
D) d
E) e
Correct Answer:

Verified
Correct Answer:
Verified
Related Questions
Q1: The preservation of beef jerky from microbial
Q3: Table 7.3<br>The following data were obtained by
Q4: Table 7.1<br>A disk-diffusion test using Staphylococcus
Q5: Figure 7.1<br> <img src="https://d2lvgg3v3hfg70.cloudfront.net/TB6915/.jpg" alt="Figure 7.1
Q6: Disinfection of water is achieved by all
Q7: Which of the following chemical agents is
Q8: One advantage of chemical plasma is that
Q9: All of the following factors contribute to
Q10: Some antimicrobial chemicals are considered to be
Q11: Table 7.4<br>The results below were obtained from