Multiple Choice
Let Which figure best represents the level curves of this function?
A) 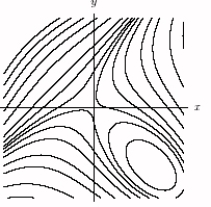
B) 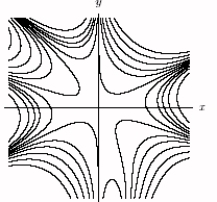
C) 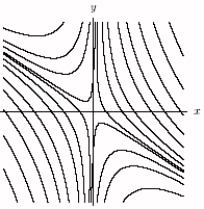
D) 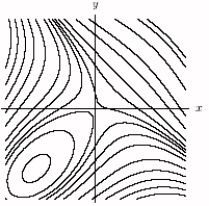
Correct Answer:

Verified
Correct Answer:
Verified
Related Questions
Q46: The temperature at each point in
Q47: Is (0, 0)a critical point of
Q48: A company has two manufacturing plants
Q49: Find the critical points of
Q50: Without calculating the discriminant, explain using
Q52: A coffee company sells three brands
Q53: The function f(x, y)has a local
Q54: Determine the nature of the critical
Q55: The function <span class="ql-formula" data-value="f
Q56: Find a and b so that