Multiple Choice
Level curves of f(x, y) are shown in the figure below.(Darker shades indicate regions with lower levels.) Is the point (-1, 2) a local maximum, a local minimum, or a saddle point of f, or is it none of these? 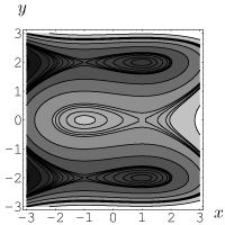
A) Saddle point.
B) Local minimum.
C) Local maximum.
D) None of these.
Correct Answer:

Verified
Correct Answer:
Verified
Related Questions
Q18: Find three numbers x, y, and
Q19: Suppose there are two electric generators that
Q20: The function <span class="ql-formula" data-value="f
Q21: The contour diagram of f is shown
Q22: The Perfect House company produces two types
Q24: Suppose that <span class="ql-formula" data-value="f
Q25: Suppose that (1, -4)is a critical
Q26: Find the critical points of
Q27: The following results are obtained when
Q28: Consider the four points A = (1,