Multiple Choice
A soft drink company is interested in seeing how the demand for its products is affected by price.The company believes that the quantity, q, of soft drinks sold depends on , the average price of the company's soft drinks, and , the average price of competing soft drinks.Which of the graphs below is most likely to represent q as a function of and ?
A) 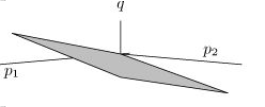
B) 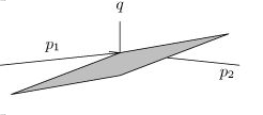
C) 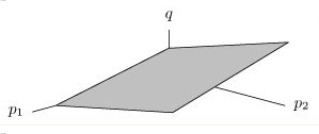
D) 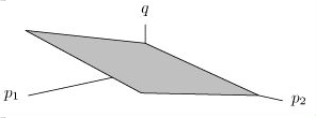
Correct Answer:

Verified
Correct Answer:
Verified
Q63: The following table gives the number f(x,
Q64: Determine a formula for the linear function
Q65: Describe the set of points whose distance
Q66: The following table gives the number f(x,
Q67: Suppose f and g are different functions
Q69: What is the slope of the
Q70: Suppose f is a function of two
Q71: Find a possible formula for a function
Q72: Draw a possible contour diagram for the
Q73: Let <span class="ql-formula" data-value="f (