Essay
The contour diagram below shows the level curves of the difference between July and January mean temperatures in ° F. 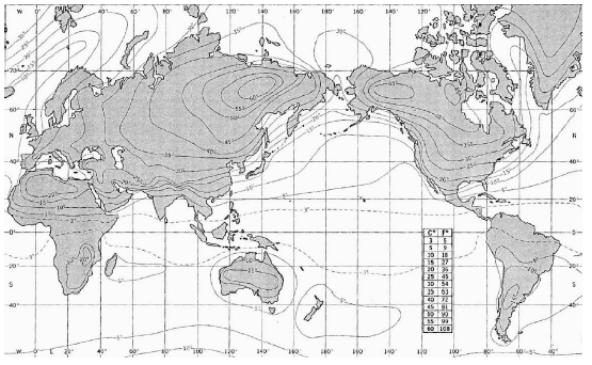 Does this graph support or contradict the claim that the largest annual temperature variations are found on the coasts of continents?
Correct Answer:

Verified
This graph supports the claim ...View Answer
Unlock this answer now
Get Access to more Verified Answers free of charge
Correct Answer:
Verified
View Answer
Unlock this answer now
Get Access to more Verified Answers free of charge
Q73: Let <span class="ql-formula" data-value="f (
Q74: Consider <span class="ql-formula" data-value="f (
Q75: Draw the level curves for z =
Q76: The points A = (-4, 5, -3),
Q77: Find a function f(x, y, z)whose
Q79: Describe in words the intersection of
Q80: Given that the equation of the
Q81: Given the table of some values of
Q82: In an exam, a student wrote
Q83: Consider the (partial)contour diagram below for a