Essay
The picture below is the contour diagram of f(x, y).The areas between contours have been shaded.Lighter shades represent higher levels, while darker shades represent lower levels. 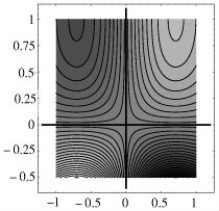 Sketch the cross section of f(x, y)with x fixed at x = 0.5.
Correct Answer:

Verified
Correct Answer:
Verified
Related Questions
Q46: Let f(x, y, z)= ax + by
Q47: Match the graph with the function.
Q48: A certain piece of electronic surveying equipment
Q49: Sketch the level set of
Q50: Yummy Potato Chip Company has manufacturing
Q52: Suppose f is a function of two
Q53: A certain piece of electronic surveying equipment
Q54: Given the table of some values of
Q55: Match the following function with the graphs
Q56: Suppose f is a function of two