Essay
Below is a contour diagram depicting D, the average fox population density as a function of , kilometers east of the western end of England, and , kilometers north of the same point. 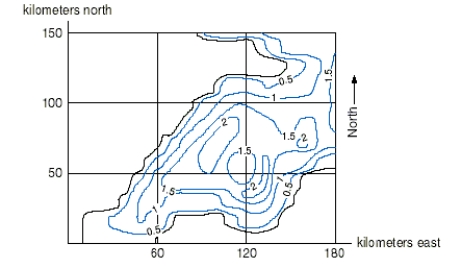 Is D increasing or decreasing at the point (120, 25)in the northern direction?
Correct Answer:

Verified
The function is increasing in ...View Answer
Unlock this answer now
Get Access to more Verified Answers free of charge
Correct Answer:
Verified
View Answer
Unlock this answer now
Get Access to more Verified Answers free of charge
Q27: (a)Find an equation of the largest sphere
Q28: Which of the following is a contour
Q29: Your monthly payment, C(s, t), on a
Q30: Suppose that the graph of a
Q31: A linear function f(x, y)has the values
Q33: Consider the sphere <span class="ql-formula"
Q34: The graph of the function f(x, y)is
Q35: Consider the figure shown below. <img
Q36: Your monthly payment, C(s, t), on a
Q37: Suppose that for all x and