Multiple Choice
Suppose that the distribution of people's ages in the United States is essentially constant, or uniform, from age 0 to age 60, and from there it decreases linearly until age 100.This distribution p(x) is shown below, where x is age in years, and p measures probability density.Such a probability distribution is called trapezoidal. 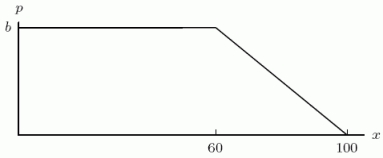 In terms of the length of the base, b, of the trapezoidal distribution (notice that the base of the trapezoid lies along the p-axis) , find the fraction of the population that is between 0 and 60 years old.
A) 20b
B) 60b
C) 40b
D) 80b
Correct Answer:

Verified
Correct Answer:
Verified
Q80: A curve is given parametrically as
Q81: Find the area of the dumbbell
Q82: The probability density function f(x)shown below describes
Q83: By the year 2016 you will have
Q84: Suppose that a new office building is
Q86: When an oil well burns, sediment
Q87: You love the function <span
Q88: You have $100,000 that you want to
Q89: AnsYou have $100,000 that you want to
Q90: A 5-gram drop of thick red