Short Answer
Which of the following diagrams represents the parametric curve ? 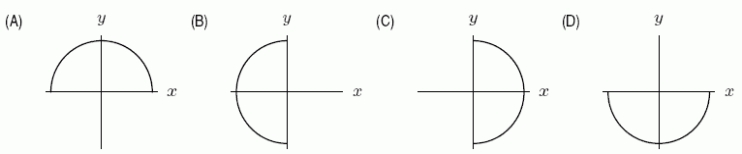
Correct Answer:

Verified
Correct Answer:
Verified
Related Questions
Q65: Given the table of data about
Q66: One fine day you take a
Q67: Consider the function <span class="ql-formula"
Q68: When light strikes a shiny surface,
Q69: The number of plants in a
Q71: Which function dominates as <span
Q72: The regular air fare between Boston and
Q73: Below is the graph of the
Q74: What is the shortest distance from
Q75: Given below are the graphs of