Multiple Choice
To study traffic flow along a major road, the city installs a device at the edge of the road at 1:00a.m.The device counts the cars driving past, and records the total periodically.The resulting data is plotted on a graph, with time (in hours since installation) on the horizontal axis and the number of cars on the vertical axis.The graph is shown below; it is the graph of the function C(t) = Total number of cars that have passed by after t hours.When is the traffic flow greatest? 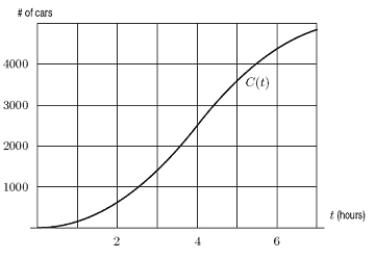
A) 2:00 am
B) 3:00 am
C) 4:00 am
D) 5:00 am
Correct Answer:

Verified
Correct Answer:
Verified
Q18: Use the definition of the derivative
Q19: The graph below gives the position of
Q20: Let t(h)be the temperature in degrees Celsius
Q21: Given the following data about a
Q22: Is the graph of <span
Q24: The length, x, of the side
Q25: A horticulturist conducted an experiment to
Q26: One of the following graphs is
Q27: Let t(h)be the temperature in degrees Celsius
Q28: Suppose that f(T)is the cost to