Multiple Choice
The graph below represents the rate of change of a function f with respect to x; i.e., it is a graph of f'.You are told that f(0) = -2.For approximately what value of x other than x = 0 in the interval 0 x 2 does
= -2? 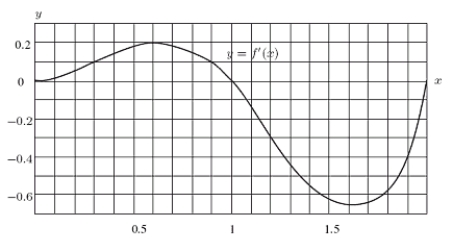
A) 0.6
B) 1
C) 1.4
D) 2
E) None of the above
Correct Answer:

Verified
Correct Answer:
Verified
Related Questions
Q74: The graph below shows the velocity of
Q75: Esther is a swimmer who prides
Q76: Is the function <span class="ql-formula"
Q77: To find the derivative of
Q78: Is the graph of <span
Q80: To study traffic flow along a major
Q81: Every day the Office of Undergraduate
Q82: There is a function used by
Q83: Estimate a formula for <span
Q84: A concert promoter estimates that the cost