Multiple Choice
One of the graphs below shows the rate of flow, R, of blood from the heart in a man who bicycles for twenty minutes, starting at t = 0 minutes.The other graph shows the pressure, p, in the artery leading to a man's lungs as a function of the rate of flow of blood from the heart.Estimate
. 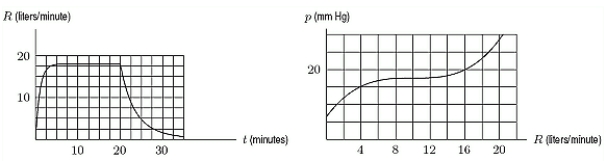
A) 26.5
B) 23
C) 17.5
D) 13
Correct Answer:

Verified
Correct Answer:
Verified
Q9: Write an equation for the graph
Q10: The illumination, I, of a candle is
Q11: Given the function <span class="ql-formula"
Q12: A one-to-one function is described in words
Q13: The cost of shipping r kilograms of
Q15: In 1909, the Danish biochemist Sören Peter
Q16: Tornados are classified in several ways.A
Q17: Consider the graph of the function
Q18: A population of bacteria is introduced
Q19: Suppose we buy quantities <span