Multiple Choice
Figure 7.1
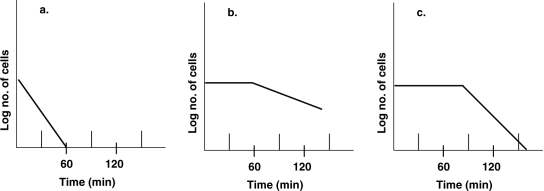
-Assume that one culture is a freshly opened package of dried yeast with 0.1% moisture, another culture is the same yeast with 7.5% moisture, and the third culture is a package of yeast mixed with water. Each culture was exposed to 130°C in a hot- air oven. Which graph in Figure 7.1 most likely shows the yeast with 0.1% moisture?
A) a
B) b
C) c
D) a and b
E) b and c
Correct Answer:

Verified
Correct Answer:
Verified
Q9: Phenolics differ from phenol in that phenolics
Q10: Figure 7.2<br>A suspension of 106 Bacillus cereus
Q11: Which one of the following is most
Q12: Which of the following is not a
Q13: All of the following contribute to hospital-
Q15: Which of the following is used for
Q16: Table 7.1<br>A disk- diffusion test using
Q17: Which of the following is not used
Q18: Table 7.3<br>The following data were obtained
Q19: The antimicrobial activity of chlorine is due