True/False
Given below is the scatter plot of the price/earnings ratio versus earnings per share of 20 U.S.companies.There appears to be a negative relationship between price/earnings ratio and earnings per share. 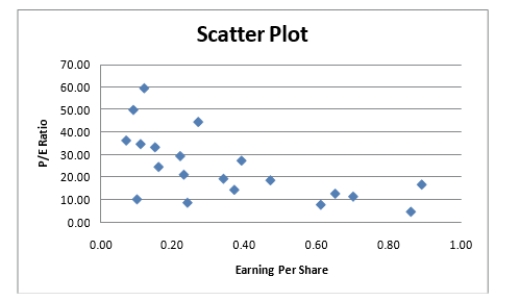
Correct Answer:

Verified
Correct Answer:
Verified
Q14: In general,grouped frequency distributions should have between
Q35: SCENARIO 2-14 <br>The table below contains the
Q45: SCENARIO 2-14 <br>The table below contains the
Q59: SCENARIO 2-12<br>The table below contains the opinions
Q60: The original data values cannot be determined
Q94: SCENARIO 2-9<br>The frequency distribution below represents the
Q95: SCENARIO 2-14 <br>The table below contains the
Q104: When constructing charts,the following is plotted at
Q108: SCENARIO 2-18<br>The stem-and-leaf display below shows the
Q154: SCENARIO 2-5<br>The following are the duration