True/False
Given below is the scatter plot of the market value (thousands$) and profit (thousands$) of 50 U.S.companies.Higher market values appear to be associated with higher profits. 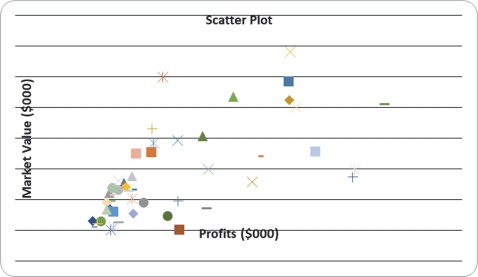
Correct Answer:

Verified
Correct Answer:
Verified
Related Questions
Q9: To determine the width of class interval,divide
Q29: SCENARIO 2-6<br>A sample of 200 students at
Q72: Percentage polygons are plotted at the boundaries
Q79: You have collected information on the consumption
Q87: SCENARIO 2-14 <br>The table below contains the
Q125: A survey of 150 executives were asked
Q139: SCENARIO 2-14 <br>The table below contains the
Q161: SCENARIO 2-14 <br>The table below contains the
Q176: SCENARIO 2-12<br>The table below contains the opinions
Q185: SCENARIO 2-14 <br>The table below contains the