Multiple Choice
SCENARIO 2-16 The figure below is the percentage polygon for the number of calories for a sample of 36 pizzas products where the upper limits of the intervals are: 310, 340, 370, 400 and 430. 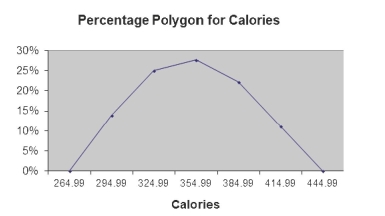
-Referring to Scenario 2-16, roughly what percentage of pizza products contains between 400 and 430 calories?
A) 0%
B) 11%
C) 89%
D) 100%
Correct Answer:

Verified
Correct Answer:
Verified
Q3: SCENARIO 2-5<br>The following are the duration in
Q10: SCENARIO 2-12<br>The table below contains the opinions
Q59: SCENARIO 2-12<br>The table below contains the opinions
Q78: A_ is a summary table in which
Q81: SCENARIO 2-16 The figure below is the
Q88: True or False: When you work with
Q94: SCENARIO 2-9<br>The frequency distribution below represents the
Q111: True or False: The stem-and-leaf display is
Q120: SCENARIO 2-8<br>The Stem-and-Leaf display represents the number
Q180: True or False: The original data values