True/False
Given below is the scatter plot of the market value (thousands$) and profit (thousands$) of 50 U.S.companies.There appears to be a negative relationship between market value and profit. 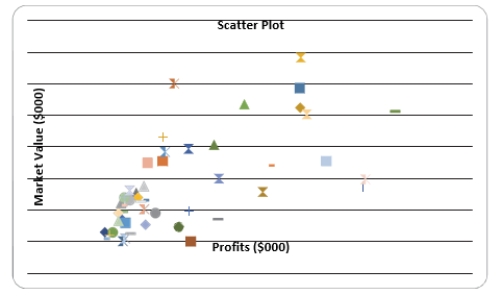
Correct Answer:

Verified
Correct Answer:
Verified
Q22: Data on the number of credit hours
Q43: The stem-and-leaf display is often superior to
Q48: SCENARIO 2-12<br>The table below contains the opinions
Q115: The Best Practices for Creating Visual Summaries
Q141: Data on 1,500 students' height were collected
Q142: SCENARIO 2-16 The figure below is the
Q143: SCENARIO 2-8<br>The Stem-and-Leaf display represents the number
Q146: SCENARIO 2-17<br>The following table presents total retail
Q160: SCENARIO 2-12<br>The table below contains the opinions
Q177: SCENARIO 2-14 <br>The table below contains the