True/False
Given below is the scatter plot of the number of employees and the total revenue ($millions) of 20 U.S.companies.There appears to be a positive relationship between total revenue and the number of employees. 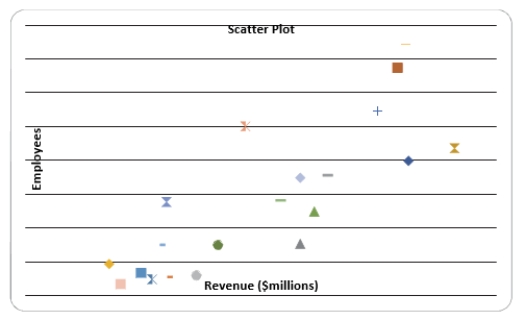
Correct Answer:

Verified
Correct Answer:
Verified
Q46: SCENARIO 2-14 <br>The table below contains the
Q55: SCENARIO 2-7<br>The Stem-and-Leaf display below contains data
Q59: SCENARIO 2-12<br>The table below contains the opinions
Q100: SCENARIO 2-14 <br>The table below contains the
Q126: SCENARIO 2-6<br>A sample of 200 students at
Q149: Relationships in a contingency table can be
Q153: SCENARIO 2-14 <br>The table below contains the
Q159: SCENARIO 2-11<br>The ordered array below resulted from
Q180: Apple Computer,Inc.collected information on the age of
Q213: SCENARIO 2-12 The table below contains the