Multiple Choice
Use the accompanying figure to answer the following question
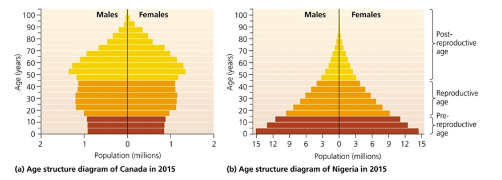
-The age structure diagram of Canada suggests that its total fertility rate (TFR) is ____________________.
A) zero
B) less than replacement rate
C) over 5.0
D) now rising but has been recently declining
E) steadily rising
Correct Answer:

Verified
Correct Answer:
Verified
Q23: According to the IPAT model,technology that enhances
Q24: The annual global growth rate of the
Q25: A population that is NOT growing will
Q26: The "sensitivity factor" in the model used
Q27: Which of the following factors drives TFR
Q29: The transitional stage in the demographic transition
Q30: In 2016,the population of the United States
Q31: The Cornucopian view held by many economists
Q32: What is a demographic transition? What are
Q33: In the demographic transition model,a country's highest