Multiple Choice
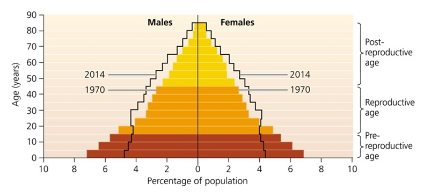
-The figure depicts age structure diagrams for 1970 and 2014. All of the following can be directly inferred from the data shown in the figure EXCEPT .
A) in 1970, females had a slightly higher life expectancy than males
B) a higher proportion of the population was elderly in 2014 than in 1970
C) Earth's population growth rate was higher in 1970 than in 2014
D) there were more people on the planet in 2014 than in 1970
E) the TFR of the planet has decreased from 1970 to 2014
Correct Answer:

Verified
Correct Answer:
Verified
Q4: If there is _,a country's population growth
Q5: Recent research suggests that _ Brazil over
Q6: Thomas Malthus warned that .<br>A) abstinence will
Q7: Which statement most accurately describes the population
Q12: According to the IPAT model,which of the
Q18: Helmut Haberl and colleagues have compiled data
Q23: According to the IPAT model,technology that enhances
Q29: The transitional stage in the demographic transition
Q37: The nations with the highest rate of
Q39: A graph of world population growth over