Multiple Choice
Refer to the graph shown.The relationship represented in the figure is called a: 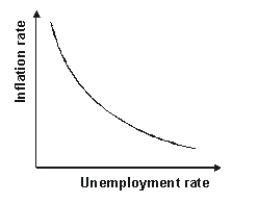
A) labor supply curve.
B) labor demand curve.
C) short-run Phillips curve.
D) long-run Phillips curve.
Correct Answer:

Verified
Correct Answer:
Verified
Related Questions
Q22: If the velocity of money is increasing,
Q34: Expectations of inflation are assumed to be
Q94: Over the last twenty years, the United
Q95: Unemployment rates above the target rate of
Q98: If the velocity of money is about
Q98: Globalization will tend to:<br>A)flatten the short-run Phillips
Q100: M2 is $8 trillion and nominal GDP
Q104: The effects of asset price inflation and
Q125: Which of the following statements is consistent
Q142: Asset price inflation occurs when the prices