Multiple Choice
Refer to the graph shown.Which of the graphs correctly depicts the long-run Phillips curve? 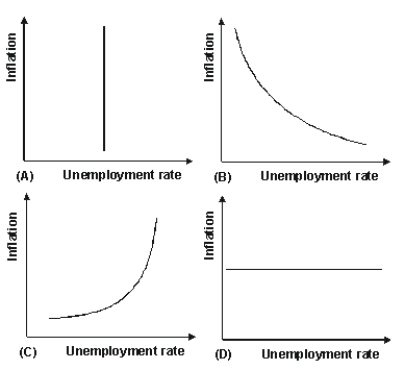
A) A
B) B
C) C
D) D
Correct Answer:

Verified
Correct Answer:
Verified
Related Questions
Q9: Asset deflation generally:<br>A)is more harmful than the
Q10: Inflation frees policy makers from<br>A)the 2.5% interest
Q45: If the money stock grows by 13
Q47: Unemployment will be at its target rate
Q49: Assuming velocity is constant, the rate of
Q81: Suppose the money supply increases by 10
Q89: The quantity theory of money implies that
Q114: The slope of the long-run Phillips curve
Q116: A reason that the quantity theory of
Q175: Inflation:<br>A)has only costs.<br>B)has both benefits and costs.<br>C)just