Multiple Choice
Refer to the graph shown.A movement from A to C is most likely to be caused by: 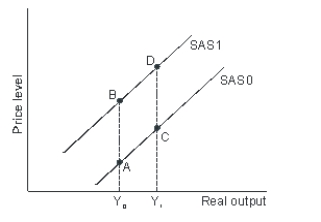
A) an increase in input prices.
B) a decrease in input prices.
C) an increase in aggregate demand.
D) a decrease in aggregate demand.
Correct Answer:

Verified
Correct Answer:
Verified
Q25: Expansionary policy that followed the 2008 recession:<br>A)led
Q71: An economy's resources:<br>A)can never be overutilized.<br>B)can always
Q104: The presence of wage and price controls
Q107: Refer to the graph shown.If the price
Q108: In 2015, the Brazilian currency, the real,
Q115: Refer to the graph shown.If the economy
Q128: A fall in the price level will:<br>A)increase
Q134: Equilibrium income is that level of income:<br>A)which
Q151: If productivity increases by 2 percent but
Q213: Fiscal policy is:<br>A)easy to enact and quick