Multiple Choice
Refer to the graph shown.A movement from D to C is most likely to be caused by: 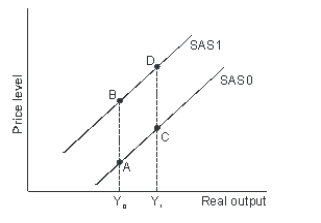
A) an increase in input prices.
B) a reduction in sales taxes.
C) an increase in aggregate demand.
D) an increase in import prices.
Correct Answer:

Verified
Correct Answer:
Verified
Related Questions
Q22: If potential output is less than actual
Q24: If the multiplier effect did not exist,
Q59: In the summer of 1953, the Korean
Q90: If actual output exceeds potential output for
Q97: If the depreciation of a country's currency
Q113: According to Keynes, the economy could become
Q145: If total income remains the same but
Q153: If potential output exceeds actual output, the
Q176: The theoretical proposition that the price level
Q214: At the intersection of the short-run aggregate