Multiple Choice
Refer to the graph shown.A movement from D to B is most likely to be caused by: 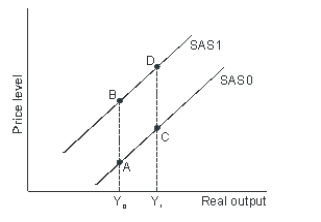
A) an increase in expected inflation.
B) a decrease in input prices.
C) a decrease in import prices.
D) a decrease in aggregate demand.
Correct Answer:

Verified
Correct Answer:
Verified
Q16: The AS/AD model looks similar to the
Q20: Suppose that consumer spending is expected to
Q41: The target rate of unemployment is:<br>A)difficult to
Q65: With an upward-sloping short-run aggregate supply curve,
Q121: The multiplier effect makes the aggregate demand
Q122: After the 2008 expansionary policy, unemployment remained
Q127: If productivity increases by 5 percent but
Q154: The short-run aggregate supply curve is upward
Q173: Keynes believed that an increase in savings
Q186: During the late 1990s in the United